


How to Read Candlestick Charts for Trading – A Complete Guide
Learn how to read candlestick charts for trading with this complete guide by NeoTrader. Master patterns, strategies, and tips to make smarter trading decisions.
Candlestick charts are the foundation of modern technical analysis, offering traders a clear visual representation of price action and market sentiment. Whether you’re a beginner learning the basics of open, high, low, and close (OHLC) or an experienced trader looking for precise reversal signals, understanding candlestick charts can transform your trading results.
In this guide, we’ll break down how to read candlestick charts step-by-step, highlight essential patterns, and show you how NeoTrader—a powerful AI-driven trading software —takes candlestick analysis to the next level.
1. Anatomy of a Candlestick: The Building Blocks
A single candlestick represents one specific time period (e.g., one minute, one hour, one day) and shows four key price points:
-
•Open – The first traded price in the period•High – The highest price reached•Low – The lowest price reached•Close – The final traded price in the period
Parts of a Candlestick :
-
•Body – The rectangle between open and close•Wicks (Shadows) – Thin lines extending above and below, marking the high and low
Color Significance :
-
•Green/White Body – Bullish candle (Close > Open)•Red/Black Body – Bearish candle (Close < Open)
2. Five Must-Know Candlestick Patterns
| Pattern | Description | Signal |
|---|---|---|
| Hammer | Small body, long lower wick | Bullish reversal |
| Shooting Star | Small body, long upper wick | Bearish reversal |
| Bullish Engulfing | Large bullish candle engulfing prior bearish | Strong bullish shift |
| Bearish Engulfing | Large bearish candle engulfing prior bullish | Strong bearish shift |
| Doji | Open and close nearly equal, tiny body | Indecision, potential flip |
3. Best Practices and Common Pitfalls
-
•Confirm Patterns with volume or other indicators (RSI, ADX)•Look at the Bigger Picture – Avoid relying on single candles; assess multiple bars•Multi-Timeframe Analysis – Patterns on daily charts generally carry more weight than intraday patterns
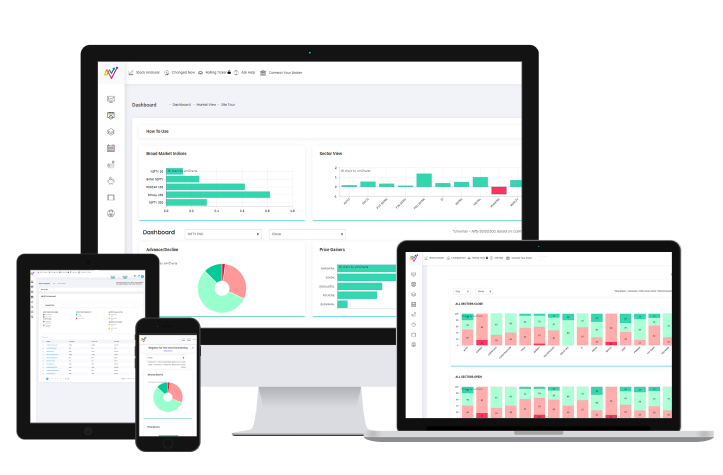
4. NeoTrader’s Candlestick Dashboard : Game-Changing Trading Software
The NeoTrader Candlestick Dashboard is designed to compress hours of chart analysis into minutes with automation and AI-powered insights.
Key Features :
-
•Preset Candlestick Patterns – Detects classic patterns like Hammer, Engulfing, and Doji instantly•Trend Scoring – Ranks top stocks by candlestick strength across timeframes•Custom Alerts & Heatmap – Instantly spot bullish or bearish setups in your watchlist
5. Speed Up Analysis: From Hours to Minutes
With NeoTrader, your candlestick analysis becomes faster and more effective :
-
•Load Your Watchlist – Import or create lists for your preferred stocks or indices•Apply Candlestick Filters – Choose patterns and timeframes; NeoTrader highlights relevant setups instantly•Review Alerts & Heatmap – Identify the strongest trading opportunities in seconds
6. Why Candlesticks Matter and How NeoTrader Helps
Candlestick patterns reveal trader psychology, capturing shifts in market sentiment that raw price data can’t.
With NeoTrader’s Candlestick Dashboard, you can:
-
•Eliminate manual chart scanning•Get instant pattern recognition backed by decades of technical expertise•Reduce decision fatigue and trade with confidence
Within minutes, you’ll have a prioritized list of actionable setups ready for execution.
7. Getting Started with NeoTrader
To start trading smarter with candlesticks :
-
1.Login to NeoTrader2.Open Candlestick Dashboard and select patterns across timeframes3.Save stocks to your customized watchlist4.Scan live markets with the Rolling Ticker for real-time setups
Even with limited technical analysis experience, NeoTrader bridges the gap—helping you make quick, informed trading decisions.
Conclusion : Your Edge in Modern Trading
Reading candlestick charts is a critical skill for traders, but doing it manually can be time-consuming and error-prone. With NeoTrader, you’re not just using another trading software—you’re leveraging an AI-powered market analysis tool that transforms complex chart data into simple, actionable insights.
Start your NeoTrader journey today and experience faster analysis, smarter trades, and better results. Let technology handle the heavy lifting—so you can focus on executing winning trades.
Like what you see? Share with a friend.


